dbt Charts: Dashboards as YAML for AI Agents (Guide)
dbt Labs open-sourced dbt Charts in Sept 2026: YAML for SQL dashboards, Apache-2.0. Covers install, init-validate-serve-render flow, AI agent skills, and MCP.
dbt Charts is a YAML language, rendering engine, and CLI (dct) for building dashboards declaratively, open-sourced by dbt Labs on September 14, 2026. In short: you define data with SQL and charts/layout with YAML, so a single auditable YAML file becomes a full interactive dashboard.
What Is dbt Charts
dbt Labs announced dbt Charts on September 14, 2026, in a blog post titled "Charts built for Chat." The release covers the YAML language spec, the rendering engine, and the dct CLI tool, all under the Apache-2.0 license as fully open source. Alongside it, a hosted platform, dbtCharts.com, launched in public beta, with pricing not yet disclosed as of September 2026. The announcement reached the Hacker News front page, gathering roughly 232 points.
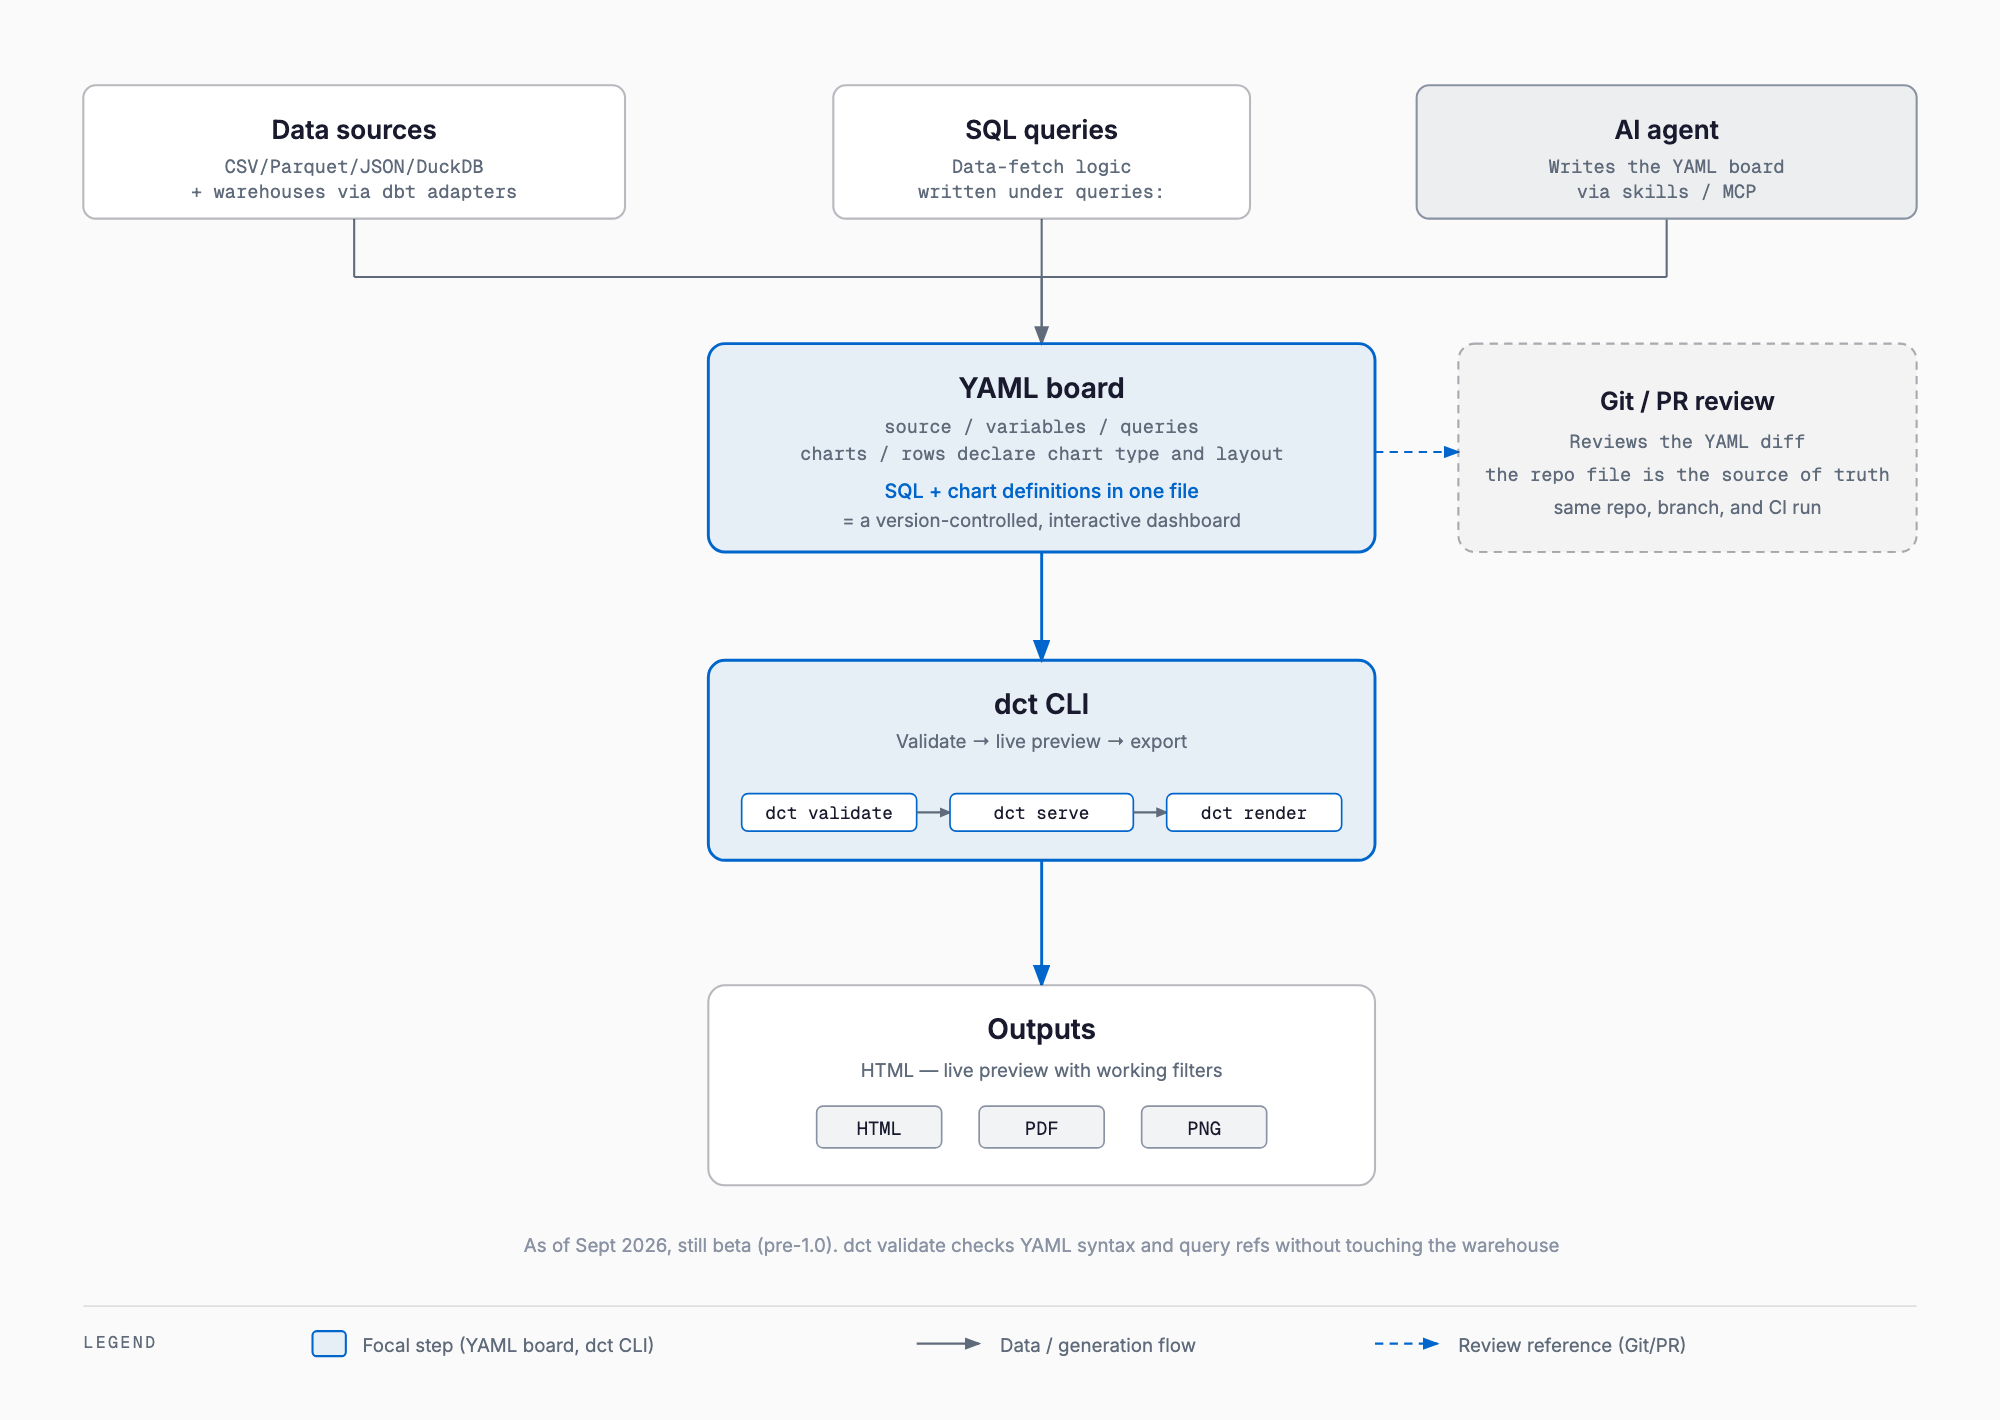
The core concept is a declarative YAML syntax wrapped around SQL for building dashboards. Queries (data) are written in SQL, while chart types, axes, filters, and row/column layout are written in YAML. Because both live in one YAML file, the entire dashboard is a single, auditable text file. Being a text file means it inherits Git's strengths directly: it's version-controlled, diffable, and reviewable in pull requests. The intended workflow places a charts/ directory next to a dbt project's models/ directory, so data transformation and dashboards live in the same repo, the same branch, and the same CI run.
What It Can Do
As of September 2026, dbt Charts is still in beta (pre-1.0) and runs on Python 3.10-3.13. Rendering is built on Vega-Lite, so its charting expressiveness is grounded in Vega-Lite's grammar of graphics. Supported chart types include 16 core types — bar, histogram, line, area, scatter, heatmap, pie/donut, KPI, table, point map, bubble map, choropleth, geoshape, callout, and spark bar — plus 13 semantic types such as lollipop, bullet, slope, bump, dot plot, stacked bars, normalized bars, streamgraph, and funnel, for 29 chart types in total.
For data, it supports local CSV, Parquet, JSON, and DuckDB files, plus warehouse connections via dbt adapters to BigQuery, Databricks, PostgreSQL, Redshift, Snowflake, Spark, and Trino. Five built-in themes are available — the default clarity, plus paper, vivid, neon, and stark — and custom themes can be defined in YAML as well.
Installation and Pricing
The core dbt Charts stack (YAML language, engine, dct CLI) is free and open source under Apache-2.0, installable via uv tool install dbt-charts or pip install dbt-charts. To include warehouse-specific dependencies, add extras, e.g. uv tool install "dbt-charts[bigquery]". The hosted dbtCharts.com platform is in public beta with pricing not yet disclosed as of September 2026. Planned future work includes integration into the main dbt CLI and connection to dbt's semantic layer.
# Install the core package
uv tool install dbt-charts
# or
pip install dbt-charts

# Install with BigQuery extras
uv tool install "dbt-charts[bigquery]"

# Start the interactive tutorial
dct skills intro
How to Use It — The Fastest Path
The basic workflow is: initialize a project (dct init), validate the YAML (dct validate), preview it locally (dct serve), then export it (dct render). dct validate checks YAML syntax and query references without touching the warehouse, which makes it a good fit for CI checks. dct serve spins up a live preview where filters actually work.
# Initialize a project
dct init

# Validate a specific YAML file (no warehouse connection)
dct validate charts/growth.yml

# Live preview with working filters
dct serve --port 8080

# Export to static formats
dct render growth --format html
dct render growth --format pdf
dct render growth --format png

# Query a data source directly
dct query db 'SELECT 1'

# Search across boards / check impact of a column change
dct search revenue
dct impact status
A real YAML file looks like the example below: source names the data source, variables declares filter variables, queries holds the SQL, charts defines chart types and axes, and rows lays out which charts appear and in what order. Having both SQL and chart definitions complete in one file is the biggest departure from GUI-driven BI tools.
source: db
variables:
  status:
    column: dundersign.documents.status
queries:
  documents: |
    SELECT DATE_TRUNC('month', created_at) AS month,
           SUM(COUNT(*)) OVER (ORDER BY month) AS documents
    FROM dundersign.documents
    WHERE {{ filter('status', status) }}
    GROUP BY 1
charts:
  growth:
    title: Documents created, all time
    type: area
    query: documents
    x: month
    y: documents
rows:
  - growth
AI Agent Integration — Skills and MCP
dbt Charts was designed with AI agents in mind from the start. dct ships with bundled agent skills that generative AI tools can reference when writing dashboard YAML, and dct docs can surface topic-specific documentation directly to an agent. It also bundles a local MCP server, letting MCP-aware clients such as VS Code or Claude Desktop operate on a dbt Charts project directly. A structured, declarative format of YAML plus SQL is easier for an LLM to produce correctly with fewer tokens than free-form code generation, and pairing that with dct validate's mechanical checks catches errors in generated dashboards early. A dbt Charts extension is also available for VS Code, including Open VSX.
How It Compares to Existing Tools
It helps to place dbt Charts among BI and dashboard tools along two axes: code-based versus GUI-based, and whether it's Git-manageable. Evidence.dev shares a similar philosophy, writing reports in Markdown plus SQL as a code-based tool. Lightdash is a GUI tool for exploring a dbt semantic layer. Rill markets itself as BI-as-code, defining dashboards through YAML-like configuration, overlapping with dbt Charts in intent. Observable Framework is JavaScript-based, offering high flexibility at the cost of more code. GUI-first BI tools in the Metabase or Looker mold are approachable without code, but their definitions typically live as in-app state, which doesn't pair well with version control.
| Tool | Definition method | Git-friendly | Positioning |
|---|---|---|---|
| dbt Charts | SQL + YAML | Native | Declarative, dbt-native dashboards |
| Evidence.dev | Markdown + SQL | Native | Code-based reporting |
| Lightdash | dbt semantic layer + GUI | Partial | Self-service BI on top of dbt |
| Rill | YAML config | Native | BI-as-code, leans real-time analytics |
| Observable Framework | JavaScript | Native | High-flexibility code-based visualization |
| Metabase / Looker-style GUI BI | GUI operations | Weak | No-code self-service BI |
Caveats and Current Limitations
As of September 2026, dbt Charts is still in beta (pre-1.0), so breaking changes remain possible. Hacker News discussion praised its readability, deterministic output, auditability, and fit for AI-generated workflows, while raising concerns about YAML's inherent expressiveness limits, weaker interactive filtering compared to GUI BI tools, and the absence of built-in governance or access-control features so far. Before adopting it as a production dashboard platform, it's worth confirming it can meet your access-control requirements at the scale you plan to run it.
FAQ
Is dbt Charts free?
The YAML language, engine, and dct CLI are fully open source under Apache-2.0 and free to use. The hosted dbtCharts.com platform is in public beta, with pricing not yet disclosed as of September 2026.
How does dbt Charts differ from Evidence?
Both are code-based and Git-manageable. Evidence.dev writes reports in Markdown plus SQL, while dbt Charts declares charts and layout in YAML alongside SQL queries.
How is dbt Charts different from Lightdash?
Lightdash is a self-service BI tool for exploring a dbt semantic layer through a GUI. dbt Charts instead has you write the dashboard itself directly as a YAML file, with no GUI-driven exploration layer.
Can AI agents generate dashboards automatically?
dct bundles agent skills and a local MCP server, so MCP-aware clients like Claude Desktop or VS Code can generate and validate YAML dashboards. dct validate also provides a mechanical consistency check.
Summary
dbt Charts gives teams that want to treat dashboards as code a new open-source option. Because everything lives in SQL and YAML, it pairs naturally with Git-based review and diffing, and its structured format suits AI-agent generation and validation well. That said, it's still in beta, and the interactive filtering and governance features that mature GUI BI tools offer are still developing. Rather than replacing an existing dashboard stack outright, a more realistic first step is trying it on a small project or an AI-generation-first workflow.
Related free tools (no sign-up, instant results)
Feel free to contact us
Contact Us